(c) 2021 by Barton Paul Levenson
A very frequent denier argument is "There's absolutely no evidence that CO2 warms the Earth!" (or sometimes "has ever warmed," etc.). I run across this all the time on FaceBook.
Of course, someone who says this got it from somewhere else, and simply doesn't know that there are mountains of evidence that CO2 is a greenhouse gas and that more of it raises the Earth's surface temperature.
In this web page I will go over the evidence from which we know carbon dioxide warms the Earth, citing references for each point.
First, what is the greenhouse effect? And how does it differ from global warming?
In brief, the greenhouse effect is how certain gases in the atmosphere keep Earth's surface warmer than it would be from sunlight alone. Global warming is when the greenhouse effect increases. The first is a process, the second is a change in that process. If we symbolize the greenhouse effect by G, global warming would be dG/dt with a positive sign (i.e, the first time derivative of G).
The first thing to note is that sunlight alone cannot make the Earth as warm as it is. Jean-Baptiste Joseph Fourier discovered this in 1824. I will cite all my references together at the end of the web page, using notation like "(Fourier 1824)." This is how peer-reviewed science journals do it.
The proof follows. It hinges on a parameter usually symbolized Te. This means emission temperature or radiative equilibrium temperature. It has also been called effective temperature.
Begin with the fact that power coming into the Earth from sunlight (Pin) has to equal power leaving the Earth by infrared radiation (Pout). We talk about power rather than energy because energy is a fixed quantity, measure in joules (J) in the SI metric system. Power is energy per unit time, measure in joules per second (J s-1), or watts (W).
1 watt = 1 joule per second.If power in was consistently greater, Earth would heat up until it vaporized. If power leaving was greater, Earth would cool down to absolute zero. The equation governing a planet's radiative equilibrium temperature is simply an expression of conservation of energy: if the planet's temperature isn't changing, power in must equal power out. The books gotta balance.
| Pin = Pout | 1 |
The 1 at the right just means this is the first equation on this web page.
Power in can be calculated as follows. Earth receives solar power on its cross-sectional area, which is that of a disk (
But Earth doesn't absorb all the sunlight that falls on it. Some is reflected away, mostly by clouds and ice. The fraction reflected back out to space is called the albedo A. Satellite photography finds Earth's albedo to be about 30%. A good recent value is A = 0.293 (Loeb et al. 2005). So in the end, power in is:
| Pin = S |
2 |
How much is power out? The Stefan-Boltzmann law says that the radiation emitted by a warm body (any warm body, it just has to be warmer than absolute zero) is proportionate to the fourth power of temperature:
| F = |
3 |
Here F is the flux density, the power emitted per unit area (in W m-2).
Multiply the flux density Earth emits by the planet's surface area and you have total power out. Earth is roughly a sphere, so the area is 4
| Pout = 4 |
4 |
Now set power in and power out equal, as in equation 1, and you can eliminate terms that occur on both sides and solve for T. We leave out ε since for this case it's always equal to 1. Here T turns out to be the radiative equilibrium temperature we're looking for, Te:
| Te = (S (1 - A) / (4 |
5 |
We plug S = 1,361.5 W m-2 and A = 0.293 into the equation and we get Te = 255 K.
Remember I said water freezes at 273 K? The sun can only heat the Earth to 255 K, but Earth's actual mean global annual surface temperature is 33 K higher, at 288 K. (This one is abbreviated TS, where S stands for surface.) Without another source of heat, Earth should be frozen solid at the surface. Fourier realized this in 1824. He didn't use the Stefan-Boltzmann law, which hadn't been discovered yet. He used something called Newton's Law of Cooling, but he got the same result. For almost 200 years, we've known that the sun can't account for how warm Earth's surface is.
Fourier had the correct insight right away. He realized that the atmosphere must act in some way to block some of the emission of infrared radiation ("chaleur obscure") by Earth's surface. He didn't know what that would be, but the problem was solved by laboratory experiments conducted by John Tyndall in 1858 (Tyndall 1861). Tyndall discovered that the strongest "greenhouse gas" in Earth's atmosphere was water vapor, closely followed by carbon dioxide. For 150 years we've known that carbon dioxide is a greenhouse gas.
Water vapor and carbon dioxide are called "greenhouse gases" by analogy with an agricultural greenhouse, which keeps itself warmer than the surroundings by preventing heat loss. This happens to some extent because the glass ceiling and walls prevent infrared light from escaping, but mostly because the ceiling blocks cooling by convection, so "greenhouse effect" isn't a very good term, and "atmosphere effect" would probably be better. Unfortunately we're now stuck with the older term.
Global warming deniers frequently cite the fact that greenhouses don't work by the greenhouse effect. We know that. We've known that since about 1900. It's irrelevant. It doesn't prove that there's no atmospheric greenhouse effect. Of course, deniers keep citing this ridiculous semantic argument anyway.
How does the greenhouse effect work? Here's a brief description.
In short, you've got both sunshine and "atmosphere shine" heating the surface. Earth's surface has the warm atmosphere next to it and that keeps it warmer, even though the warm air gets its warmth from the surface in the first place.
A lot of people find this hard to understand, and global warming deniers are constantly saying that the greenhouse effect means greenhouse gases are creating energy out of nowhere, which can't happen. They're right that the air can't create energy out of nowhere. But it doesn't have to. Energy isn't being created by the greenhouse effect, only moved around. Remember that temperature is not the same thing as energy. Energy has to be conserved. Temperature does not. As long as the energy leaving the top of the atmosphere equals the energy coming in, there is no violation of physical laws.
I don't have to demonstrate mathematically that this is possible, although I will anyway below. I need only point out that you can detect atmospheric back-radiation with instruments. The pyrgeometer, in use at least since 1954, is an instrument designed to do just that, and it does. You can also detect the atmospheric back-radiation with a camera with infrared-sensitive film. Global warming deniers who try to say that atmospheric back-radiation can't exist because a cooler body can't radiate to a warmer body, or because it would violate the second law of thermodynamics, don't know what they're talking about. It does exist and it violates no physical laws at all. A mathematical demonstration follows.
Picture three layers: space, the air, the ground. Our equation 1, power in has to equal power out, applies to space--as much power as it inputs to the Earth system has to come back out of the Earth system. Let's call the flux density received from space Q, for quantity, while the amount coming up from the air is A. We have:
| Q = A | 6 |
The air is completely transparent to sunlight--it's a "glass slab." But it absorbs all infrared light, making it an electromagnetic "black body." If we call the flux density coming up from the ground F, then the air gets all of F and space gets none of it.
But how much does the air emit? We know it's emitting amount A to space. But it has both a bottom and a top. Space has no top, and for climate purposes we can assume the ground has no bottom, since miles of earth and rock insulate pretty darn well. The air must emit A down to Earth as well as up to space.
But it can't create energy out of nowhere. Its only energy input is the infrared radiation from the ground, F. Therefore, the magnitude of A must be only half of F. The power balance for the air is:
| F = 2 A | 7 |
For completeness, the power balance for the ground is:
| F = Q + A | 8 |
Let's put some numbers into these very simple equations. Q is fairly easy to find. We have the solar constant coming in, but 29.3% of that is radiated back out to space, so 1,361.5 W m-2 becomes 962.58 W m-2. But remember that while Earth receives solar power on its cross sectional area,
Using equation 6, we also know that Q = A, so A must also be 240.65 W m-2. And using the Stefan-Boltzmann law, this means the temperature of our glass slab atmosphere must be 255 K--the same as Earth's radiative equilibrium temperature. That isn't a coincidence, of course.
Now using equation 8, we can conclude that the ground is getting Q + A. This adds up to 481.3 W m-2. And by the Stefan-Boltzmann law, that gives it a temperature of 304 K.
As I said earlier, Earth's actual surface temperature is about 288 K these days, so the glass slab model isn't super-accurate. But it gives the general idea. All the equations balance, no energy is created out of nowhere, and yet the surface winds up warmer than it would be from Q alone. The greenhouse effect works.
And it doesn't just work on Earth. Venus is 735.3 K at the surface, hotter than a self-cleaning oven, mostly because it has a thick atmosphere of carbon dioxide. And Mars has almost a pure carbon dioxide atmosphere as well, which heats it just a few degrees to 214 K. Here are Te and TS for Venus, Earth, and Mars. We add a new symbol, TG, to show the strength of the greenhouse effect on each. This is just TS - Te
| Planet | Te (K) | TS (K) | TG (K) |
|---|---|---|---|
| Venus | 227 | 735 | 508 |
| Earth | 255 | 288 | 33 |
| Mars | 210 | 214 | 4 |
We've seen, so far, that science has known for 200 years that there is a greenhouse effect, and has known for 150 years which greenhouse gases are responsible for it. We also know that the mechanism of the greenhouse gas can be verified by pyrgeometers, infared-sensitive film, and arithmetic using simple logic and the well-validated Stefan-Boltzmann law. We now turn to global warming, where more evidence that CO2 is driving the warming awaits.
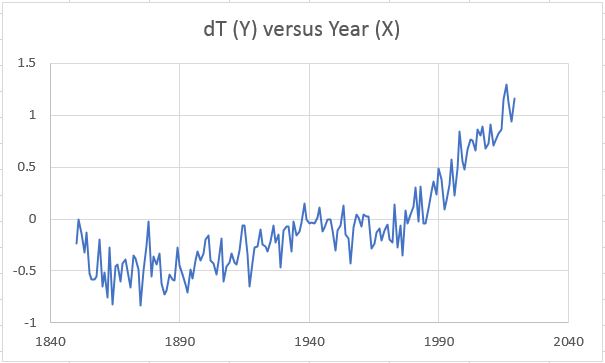
Here's how temperature has risen with time. The time series used for temperature here is the Hadley Centre CRUTEM4 data from 1850 to 2019:
|
Here's CO2 (on the vertical or Y axis) graphed against temperature anomaly (on the horizontal or X axis). CO2 data is from the Mauna Loa observatory for 1959-2019 and the Law Dome ice cores before that:
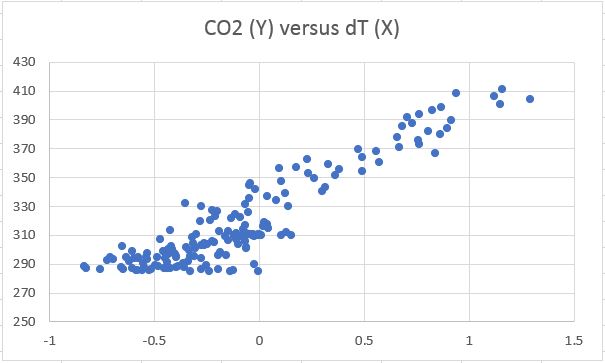 |
The correlation (Pearson's r) between the two is 0.9213, so the coefficient of determination is r2 = 0.8488. With this sample size, this correlation is significant at the level p < 6.7 x 10-170.
As they will tell you in any statistics class, correlation does not prove causation. But when you predict the correlation ahead of time, and then find it, yes, it's evidence. Maybe not conclusive evidence, but it matters.
Is there more evidence? Of course there is, there are mountains of it, but I don't want to make this web page infinitely long. The smoking gun that it's greenhouse gases--primarily carbon dioxide--driving the present global warming comes from spectroscopic evidence. The intensity of absorption lines of greenhouse gases has increased by just the amount we should have expected from the known increases in each gas. Here are just three of the field studies, using equipment to observe the environment. Philipona et al. 2004:
...Here we show that atmospheric longwave downward radiation significantly increased (+5.2(2.2) W m-2) partly due to increased cloud amount (+1.0(2.8) W m-2) over eight years of measurements at eight radiation stations distributed over the central Alps. Model calculations show the cloud-free longwave flux increase (+4.2(1.9) W m-2) to be in due proportion with temperature (+0.82(0.41) C) and absolute humidity (+0.21(0.10) g m-3) increases, but three times larger than expected from anthropogenic greenhouse gases. However, after subtracting for two thirds of temperature and humidity rises, the increase of cloud-free longwave downward radiation (+1.8(0.8) W m-2) remains statistically significant and demonstrates radiative forcing due to an enhanced greenhouse effect.
See also Philipona et al. 2012.
Evans and Puckrin 2006:
The earth's climate system is warmed by 35 C due to the emission of downward infrared radiation by greenhouse gases in the atmosphere (surface radiative forcing) or by the absorption of upward infrared radiation (radiative trapping). Increases in this emission/absorption are the driving force behind global warming. Climate models predict that the release of greenhouse gases into the atmosphere has altered the radiative energy balance at the earth's surface by several percent by increasing the greenhouse radiation from the atmosphere. With measurements at high spectral resolution, this increase can be quantitatively attributed to each of several anthropogenic gases. Radiance spectra of the greenhouse radiation from the atmosphere have been measured at ground level from several Canadian sites using FTIR spectroscopy at high resolution. The forcing radiative fluxes from CFC11, CFC12, CCl4, HNO3, O3, N2O, CH4, CO and CO2 have been quantitatively determined over a range of seasons. The contributions from stratospheric ozone and tropospheric ozone are separated by our measurement techniques. A comparison between our measurements of surface forcing emission and measurements of radiative trapping absorption from the IMG satellite instrument shows reasonable agreement. The experimental fluxes are simulated well by the FASCOD3 radiation code. This code has been used to calculate the model predicted increase in surface radiative forcing since 1850 to be 2.55 W/m2. In comparison, an ensemble summary of our measurements indicates that an energy flux imbalance of 3.5 W/m2 has been created by anthropogenic emissions of greenhouse gases since 1850. This experimental data should effectively end the argument by skeptics that no experimental evidence exists for the connection between greenhouse gas increases in the atmosphere and global warming.
Finally, Feldman et al. 2015:
The climatic impact of CO2 and other greenhouse gases is usually quantified in terms of radiative forcing1, calculated as the difference between estimates of the Earth's radiation field from preindustrial and present-day concentrations of these gases. Radiative transfer models calculate that the increase in CO2 since 1750 corresponds to a global annual-mean radiative forcing at the tropopause of 1.82 ± 0.19 W m-2 (ref. 2). However, despite widespread scientific discussion and modelling of the climate impacts of wellmixed greenhouse gases, there is little direct observational evidence of the radiative impact of increasing atmospheric CO2. Here we present observationally based evidence of clear-sky CO2 surface radiative forcing that is directly attributable to the increase, between 2000 and 2010, of 22 parts per million atmospheric CO2. The time series of this forcing at the two locations--the Southern Great Plains and the North Slope of Alaska--are derived from Atmospheric Emitted Radiance Interferometer spectra3 together with ancillary measurements and thoroughly corroborated radiative transfer calculations4. The time series both show statistically significant trends of 0.2 W m-2 per decade (with respective uncertainties of ±0.06 W m-2 per decade and ±0.07 W m-2 per decade) and have seasonal ranges of 0.1-0.2 W m-2. This is approximately ten per cent of the trend in downwelling longwave radiation5,6,7. These results confirm theoretical predictions of the atmospheric greenhouse effect due to anthropogenic emissions, and provide empirical evidence of how rising CO2 levels, mediated by temporal variations due to photosynthesis and respiration, are affecting the surface energy balance.
I could go on citing studies all day, but nothing will convince a denier to whom this is all a matter of tribal politics and evidence doesn't matter. But I hope any reasonable person of good will can see from what I've presented here that there is a great deal of evidence that carbon dioxide warms the Earth. Evidence both from climate science and from planetary astronomy, my fields of study. Global warming is real, human technology is causing it (check here for more evidence), and it's a deadly danger to our civilization. We have to do something major about it as soon as possible, and the deniers aren't helping.
Evans, W.F.J., Puckrin, E. 2006. Measurements of the radiative surface forcing of climate. 18th Conference on Climate Variability and Change, P1.7.
Feldman, D.R., Collins, W.D., Gero, P.J., Torn, M.S., Mlawer, E.J., Shippert, T.R. 2015. Observational determination of surface radiative forcing by CO2 from 2000 to 2010. Nature 519, 339-343.
Fourier, J.-B. J. 1824. Mémoire sur les Témperatures du Globe Terrestre et des Espaces Planétaire. Mémoires de l’Académie Royale des Sciences de l’Institute de France 7, 570-604.
Kopp, G., Lean, J.L. 2011. A new, lower value of total solar irradiance: Evidence and climate significance. Geophysical Research Letters 38 L01706.
Loeb, N.G., Wielicki, B.A., Doelling, D.R., Smith, G.L., Keyes, D.F., Kato, S., Manalo-Smith, N., Wong, T. 2009. Toward optimal closure of the Earth's Top-of-Atmosphere radiation budget. Journal of Climate 22, 748-766.
Philipona, R., Dürr, B., Marty, C., Ohmura, A., Wild, M. 2004. Radiative forcing--Measured at Earth's surface--Corroborate the increasing greenhouse effect." Geophysical Research Letters 31, L03202.
Philipona, R., Kräuchi, A., Brocard, E. Solar and thermal radiation profiles and radiative forcing measured through the atmosphere. Geophysical Research Letters 39, L13806.
Tyndall, J. 1861. VII. Note on the transmission of radiant heat through gaseous bodies. Proceedings of the Royal Society of London 10, 37-39.
| Page created: | 12/20/2021 |
| Last modified: | 12/20/2021 |
| Author: | BPL |